Energy management technology · Indiana manufacturing

Energy Management Technology for Indiana Business

Your utility sees every kilowatt you buy and runs it through a rate book you never see. Our two systems put that same view on your side of the meter: one to lower what you pay for power, one to protect everything that runs on it.

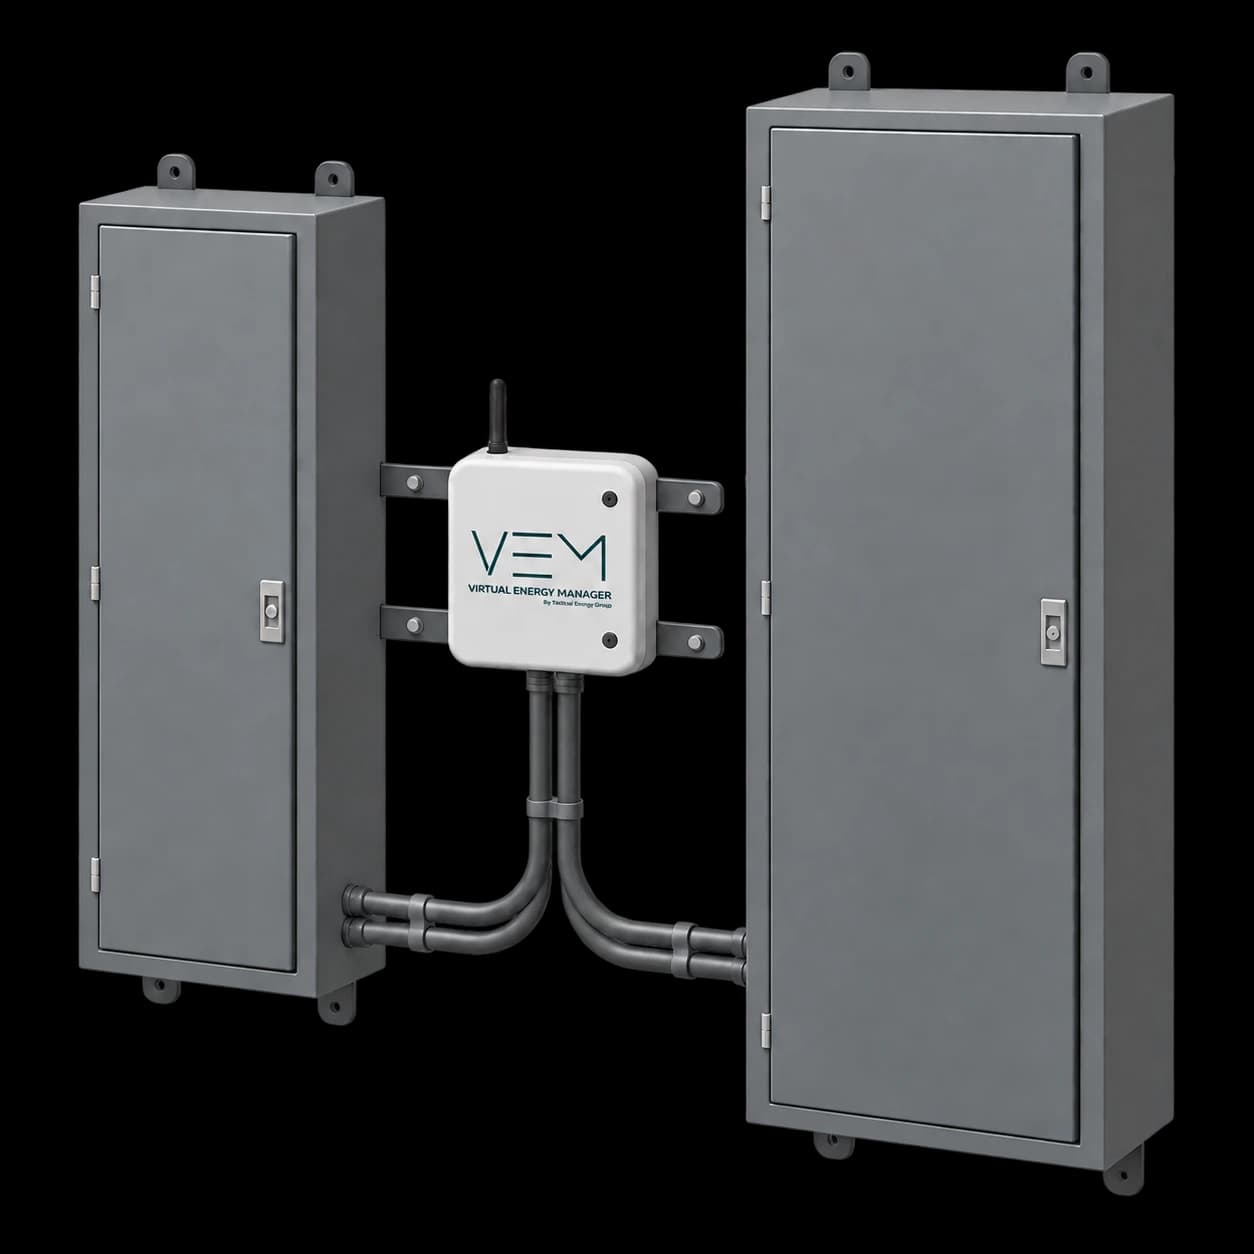
Existing TEG monitoring enclosure artwork

200+ load profiles under management

10% to 30% the savings range our VEM users see

99.8% accurate, revenue-grade metering

NIPSCO · I&M · Duke · AES rate books built into the software

01 / problem

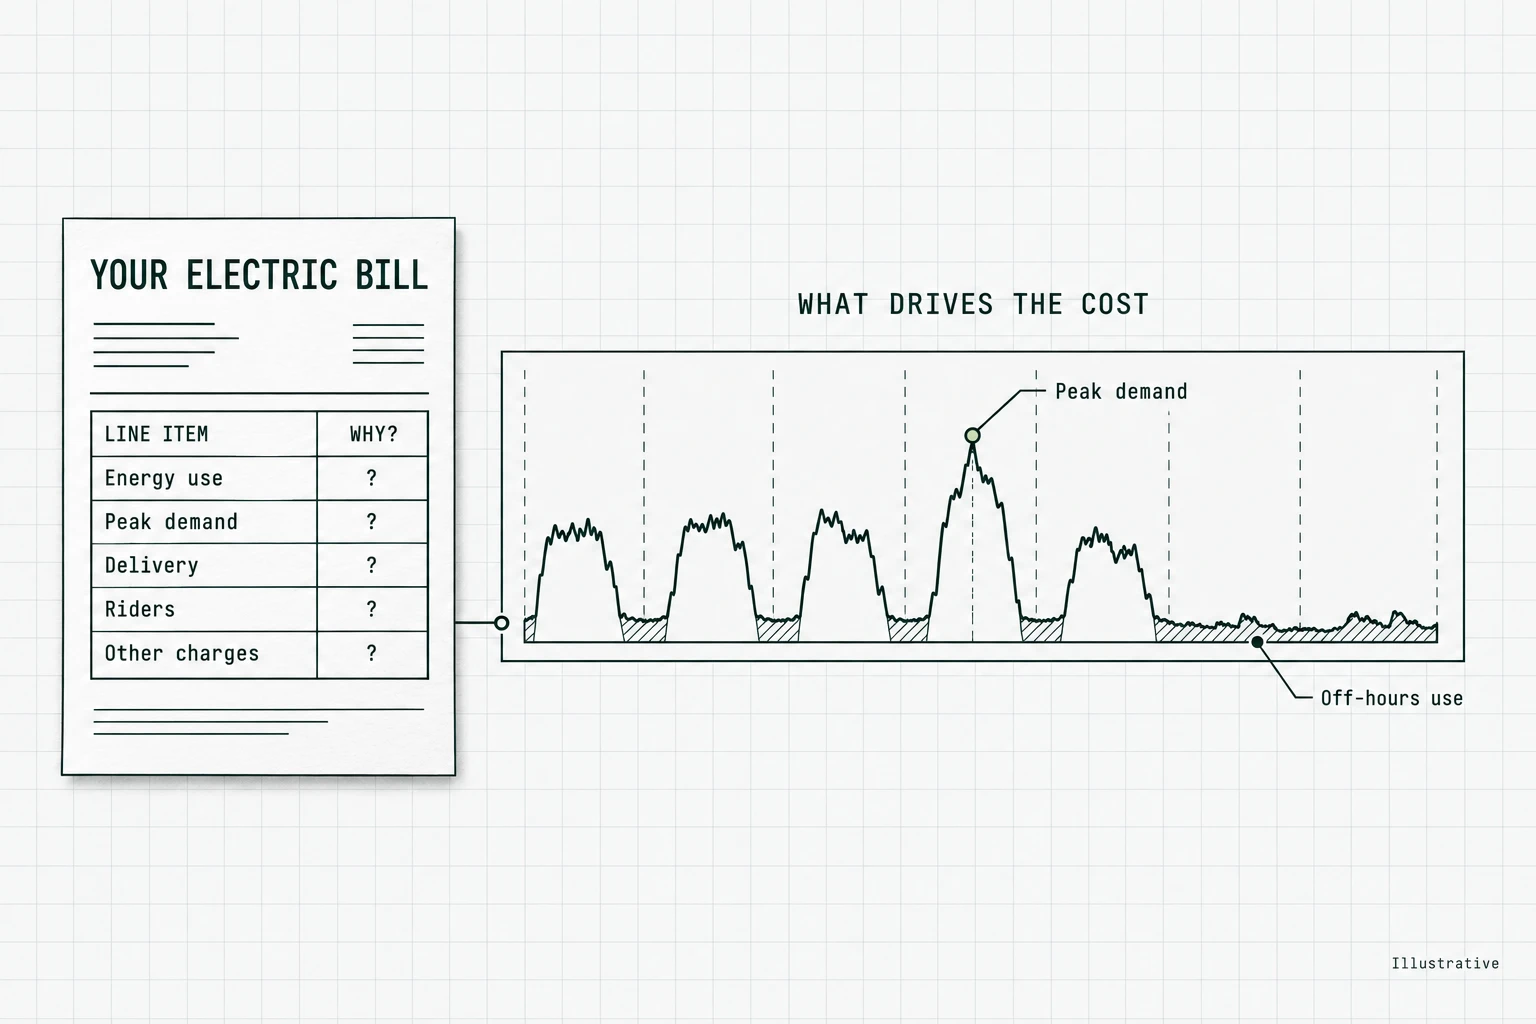
The bill tells you what you owe. It doesn't tell you why.

At the end of the month the utility runs your usage through its rate calculator and sends you a bill. Most people in your seat look at it, see that it's about the same as last month, and pay it.

The utility's smart meter portal gives you data, but try building a cost-saving plan out of it.

And when power quality goes wrong, whether that's a surge, a sag, or a lost phase, the damage shows up months later as a motor that wore out early, and no one ever ties it back to the power.

Energy is one of your top operating expenses, and you'd rather not have to think about it. Both systems are built so energy doesn't become one more thing you have to manage.

A bill headed YOUR ELECTRIC BILL, its line items each ending in a question mark, connected to a week of interval usage under the heading WHAT DRIVES THE COST, with the peak demand marked and the off-hours use hatched along the baseline.

02 / which system

Which question brought you here?

Two systems, two different questions.

Where is our energy money going, and what should we change?

VEM finds the power you're paying for and don't need, then shows you how to buy the power you do need at a lower cost on your specific rate.

Energy waste found and priced in dollars

Your rate's billing rules laid over your real usage

Goals, training, and our team to help you hit them

See how VEM lowers cost →
What is the utility actually sending us, and can we prove it?

Power Guard watches the quality of your incoming power around the clock, warns you when conditions threaten your equipment, and keeps the timestamped record you need when the utility has to answer for it.

Surges, sags, phase loss, harmonics, frequency, power factor, transformer loading

Keeps working through outages (cellular and battery-backed)

A paper trail for the utility and your insurer

See how Power Guard protects equipment →

03 / side by side

Side by side

On a VEM installation, the Power Guard dashboards run on the same hardware. Power Guard can also be installed on its own.

Virtual Energy ManagerPower Guard
The questionWhere is our energy money going?What is the utility sending us?
What it watchesHow much power you use, when, and how your rate bills itThe quality and reliability of the power coming in
What you do with itGet rid of waste, control demand, lower your cost per kilowatt hourAct before damage, document every event, escalate to the utility
Who uses itPlant and operations managers, finance, sustainabilityMaintenance, operations, plant leadership
Where it installsBetween the utility supply and your main distribution panelBetween the transformer and your main distribution panel
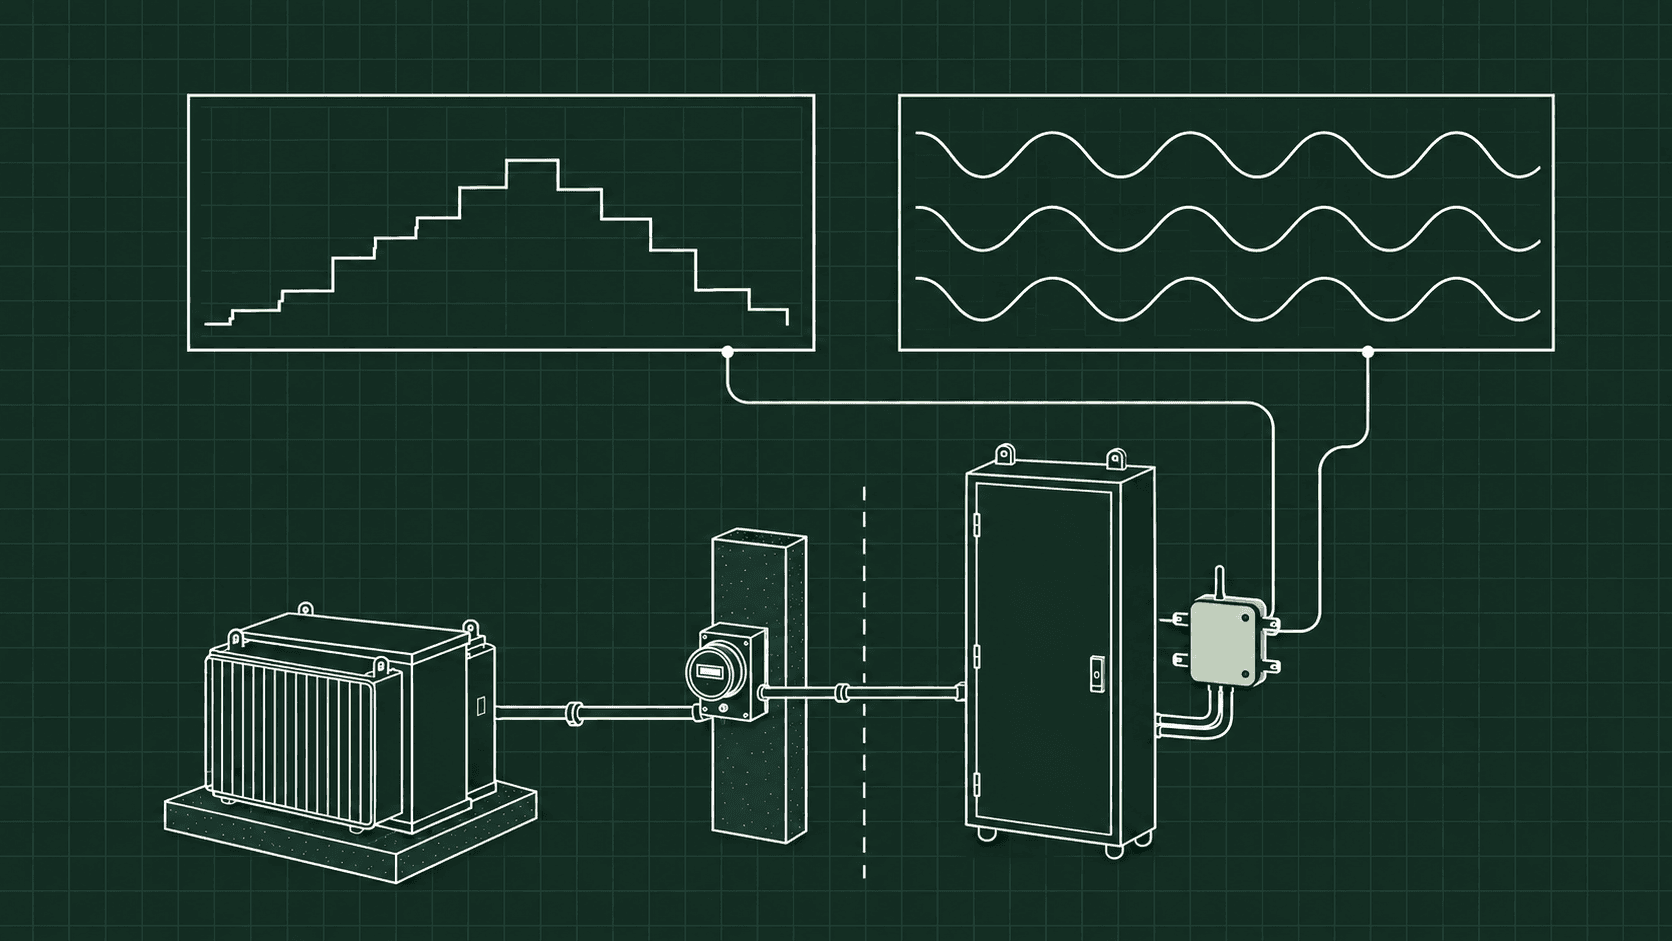
VEMWhat you pay
PowerGuardWhat you’re sent
Transformer to meter to main panel, with a customer-side compact monitor feeding equally sized VEM cost and PowerGuard power-quality views.
Utility’s sideYour side

04 / how built

Built from your utility meter in

All on your property.

Our hardware installs on the equipment you own. Nothing the utility owns gets touched.

As little hardware as possible.

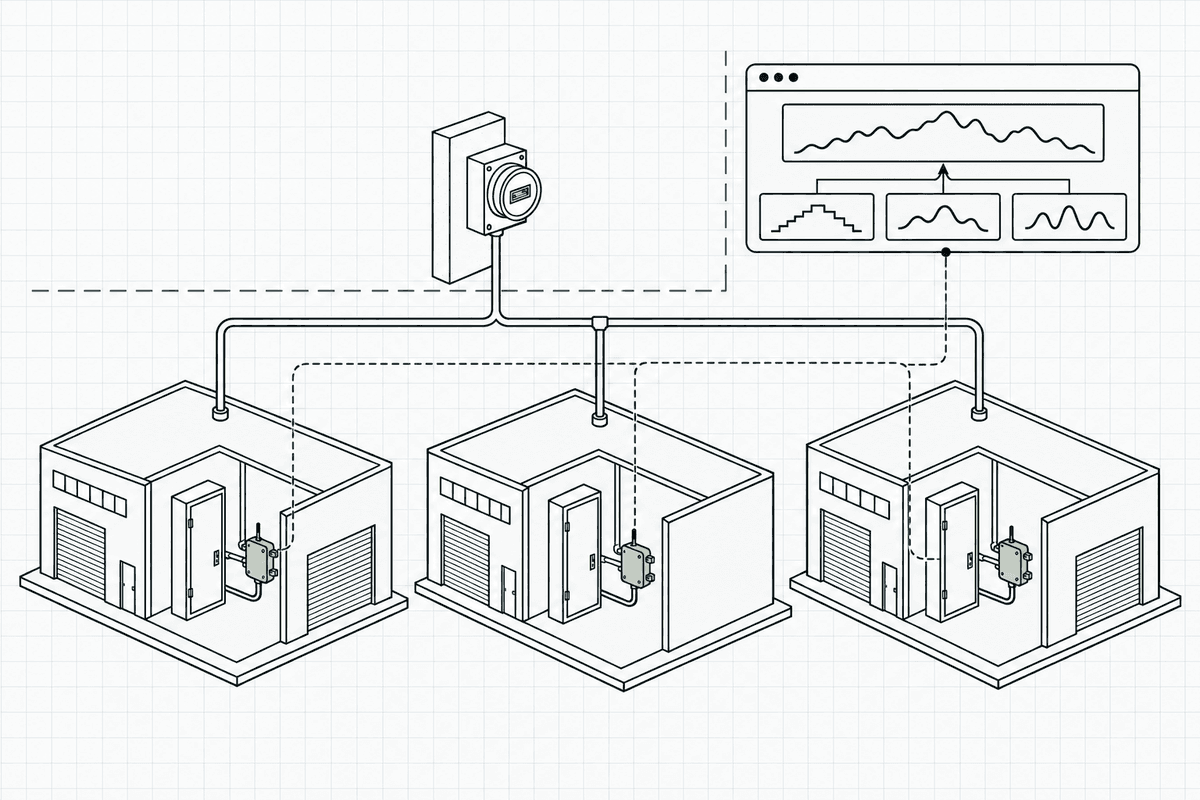
We capture as far upstream as we can, at your main distribution panels, so you get the most useful data from the smallest install. Submetering comes later, and only if what we see upstream justifies it.

What the utility sees, you see.

We recreate the exact load profile running through your utility meter, so every number we show you ties back to what you're billed.

Live.

Data refreshes every couple of seconds, not the next day and not at the end of the month.

Your rate, in code.

We've broken each NIPSCO, I&M, Duke, and AES rate book down into the software, so we run your usage through the same billing process the utility uses.

People behind it.

Our team supports you on Teams calls and on site.

Three monitored buildings feed panel readings into one aggregate software profile corresponding to the utility meter, across a marked ownership boundary.
Utility’s side → Your sideTEG hardwareAggregate = what the utility bills

05 / management loop

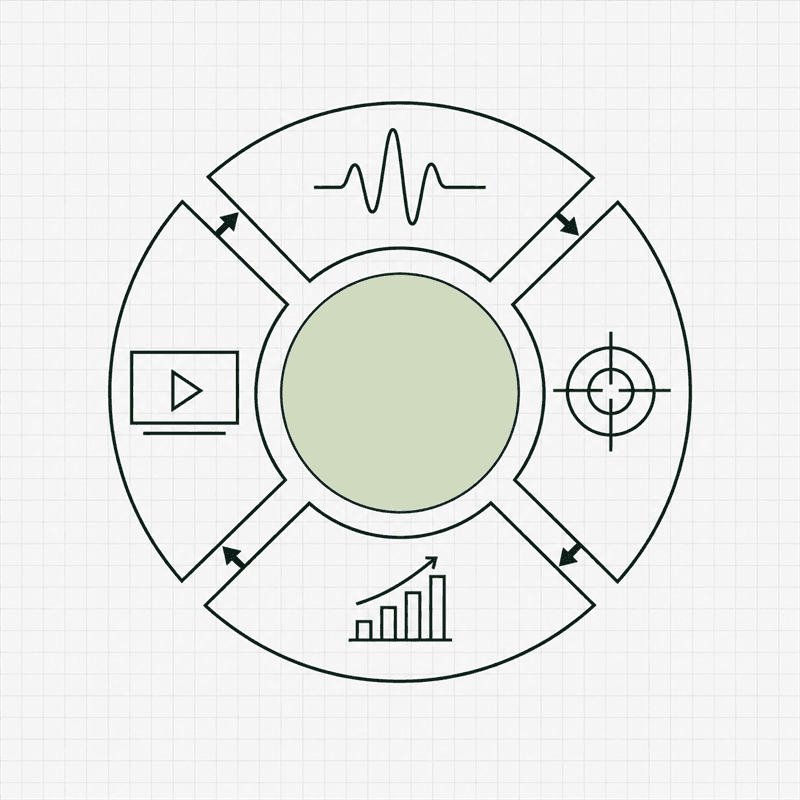
Monitoring is a feature. Management is the loop.

A monitoring system gives you a lot of data and leaves you to figure out what to do with it. These systems run a four-part loop so you always know what to do next.

01

Monitoring.

Your live data, turned into information.

02

Goal setting.

Achievable targets for the numbers that drive your cost.

03

Analytics.

Revenue-grade, utility-specific, rate-based feedback on how you're doing.

04

Training.

What to do in your building, with your equipment, on your schedule.

A four-step loop of monitoring, goal setting, analytics, and training.
MonitoringGoal settingAnalyticsTraining

Our users land anywhere between 10% and 30% savings. What makes the difference is how much of the practice they build into how they operate.

06 / proof

What it looks like in Indiana plants

Jayco RV · Middlebury campus

Off-shift usage cut in half

Before: 47% of usage happened off-shift

After: cut in half in about 12 months, and held or improved for a couple of years since

Lifetime savings: over $600,000

About 40 buildings on one campus · VEM customer for multiple years

Jayco off-shift usage falls from 47% to approximately 23.5%, half the starting share, in about 12 months.47%OFF-SHIFTCUT IN HALFAT STARTABOUT 12 MONTHSLATERABOUT 40 BUILDINGS
47% OFF-SHIFT AT STARTCUT IN HALF · ABOUT 12 MONTHSABOUT 40 BUILDINGS

Across the 180 load profiles we studied, there's an 80% chance any given one has 25% or more energy waste.

One injection molder in Elkhart was running 50 kW around the clock every weekend. That was only 3% of its usage, but it cost almost $17,000 a year.

07 / getting started

From first call to live data

01

A 10-minute survey.

We text a link to your maintenance lead. It walks them to your transformer and main panel for a few numbers and photos.

02

A design and a proposal.

Your electrical layout tells us exactly what hardware you need. You get the costs and the business case in writing.

03

Installation.

A TEG-certified technician does the install.

04

Connected and baselined.

We build your dashboards, match your data to your utility bill, and set your baseline.

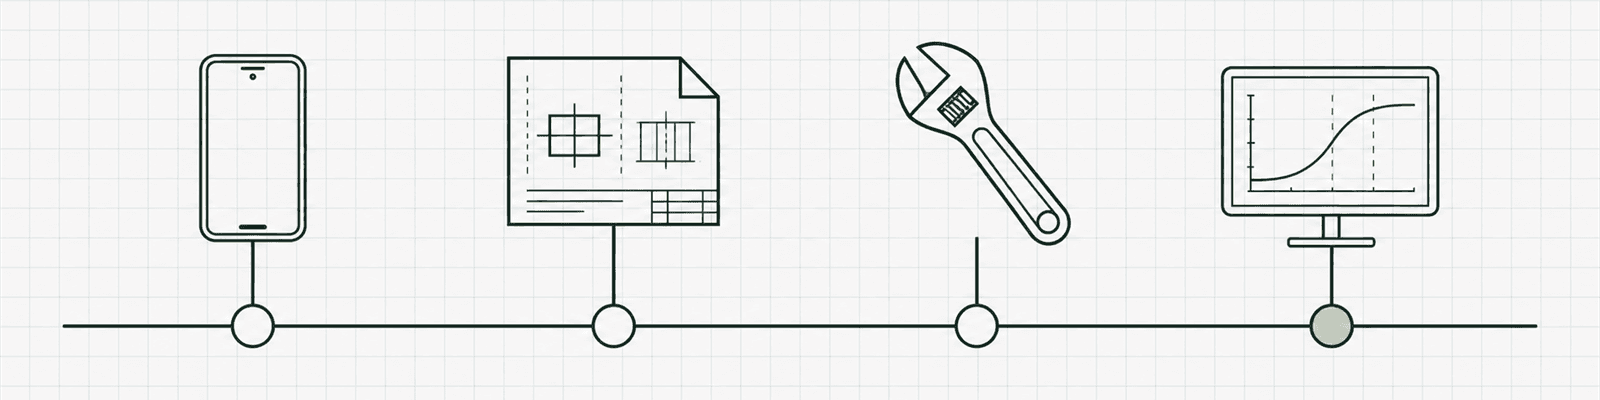
Four-step timeline from survey to live data.
1 · Survey2 · Design + proposal3 · Install4 · Connected + baselined
Where to start

Choose your next step

Explore the Manufacturers Energy Grant Program, or book an Energy Decision Blueprint session to discuss your toughest energy questions.

When you want a second set of eyes on the bills you already pay

Manufacturers Energy Grant Program

Manufacturers from qualifying Indiana counties receive a free monthly 35-point audit of their electric bills for cost recovery and savings. No obligation and no vendor picks.

Claim your Grant

When a project, proposal or decision is already on your desk

The Energy Decision Blueprint

The Energy Decision Blueprint gets you a free in-depth strategic assessment of your project, problem, or question by the TEG team. Move forward and design your solution with absolute confidence.

Get the Blueprint

09 / faq

Questions before the first call

Do we need both systems?

No. VEM answers the cost question and Power Guard answers the power quality question. When both run together, they share the same hardware.

Who does the install?

A TEG-certified technician, working from a design built on your facility's own survey.

Do you touch the utility's equipment?

No. Everything we install sits on the side of the meter you own.

Which utilities do you work with?

NIPSCO, Indiana Michigan Power, Duke, and AES Indiana. Each of those rate books is built into our software.

What does it cost?

Every system is designed to your facility, so pricing comes after the survey. There are two one-time costs, hardware and setup, and one ongoing service fee that's a small percentage of your annual electric spend.

10 / closing

Want to win with your facility's next energy project?

The Energy Decision Blueprint is a free, written second opinion for Indiana operators spending five figures or more a month on electricity. One short call, your bills, and we do the rest.

Get the Blueprint