

$17,000 a year from 3% of usage.
An Elkhart injection molder running 24-5 had 50 kW running all weekend.
Energy Technology · Virtual Energy Manager (VEM)
VEM is an energy monitoring and management system for Indiana manufacturers. It puts hardware on your side of the meter and your utility's rate book in the software, and our team helps you act on what it shows. It's a very good hedge against rate inflation.
10% the reliable low end our users save
Up to 30% with strong adoption
$600K+ lifetime savings at Jayco RV
200+ load profiles under management
01 / problem
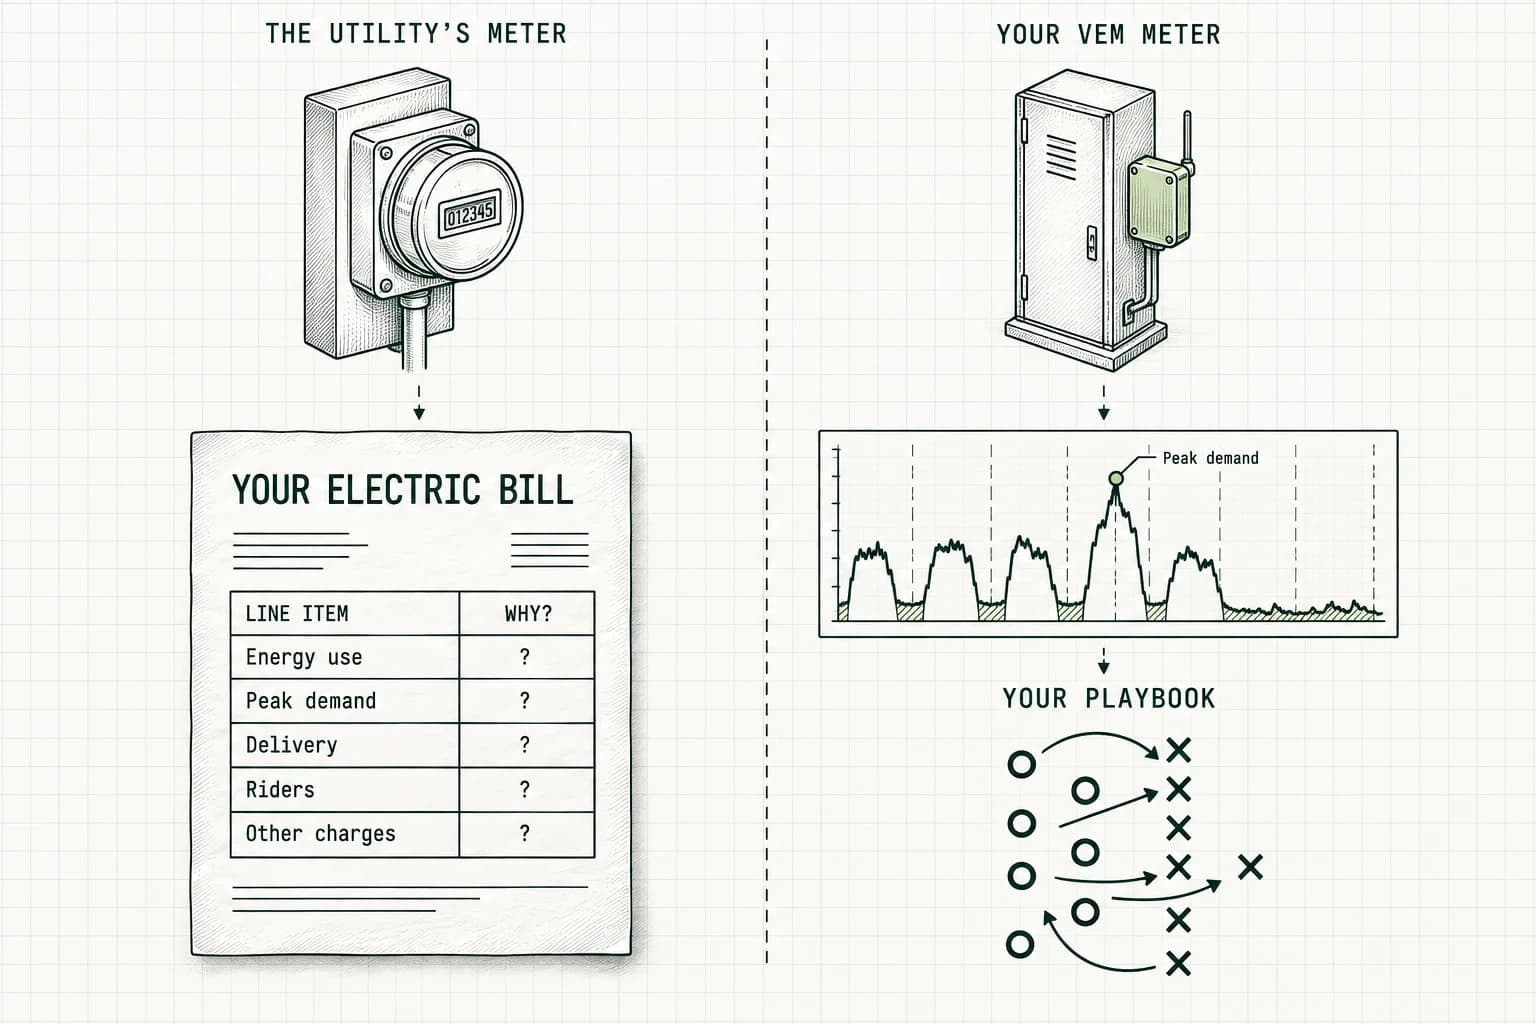
The utility sees all the power you buy, and it has the advantage of billing you for it. It runs your usage through its rate calculator, and at the end of the month you get a number.
What you don't get is why. You're billed on your peak, not your average. Equipment you thought was off keeps running on a timer. The day Derek fills in for Todd and runs things a little differently can set your demand charge for the whole month.
VEM gives you equal footing with the utility: how much power you're buying, when you're using it, and how to take advantage of the way you're billed.
02 / fit
VEM fits Indiana operations that:
03 / Lever one · use less energy
Every operation has times when it's producing and times when it isn't. Power used during production helps you make product and turn a profit. Power used when you're shut down is what we call energy overhead, and it's the low-hanging fruit.
VEM lays your operating hours over your load profile and calculates, live, what share of your bill is being used when no one is producing. You set a goal against that number. Our team helps you trace what's driving it and write the startup and shutdown procedures to get rid of it. You hit the goal, set a better one, and keep going. Getting to somewhere between 3% and 5% energy overhead is a really great place to be.
An Elkhart injection molder running 24-5 had 50 kW running all weekend.
At one Jayco building, trailing usage at the end of the day cost $10,813 a year, and the early start cost another $4,055.
A woodworking facility in Elkhart was using most of its power when no one was working, without knowing it.
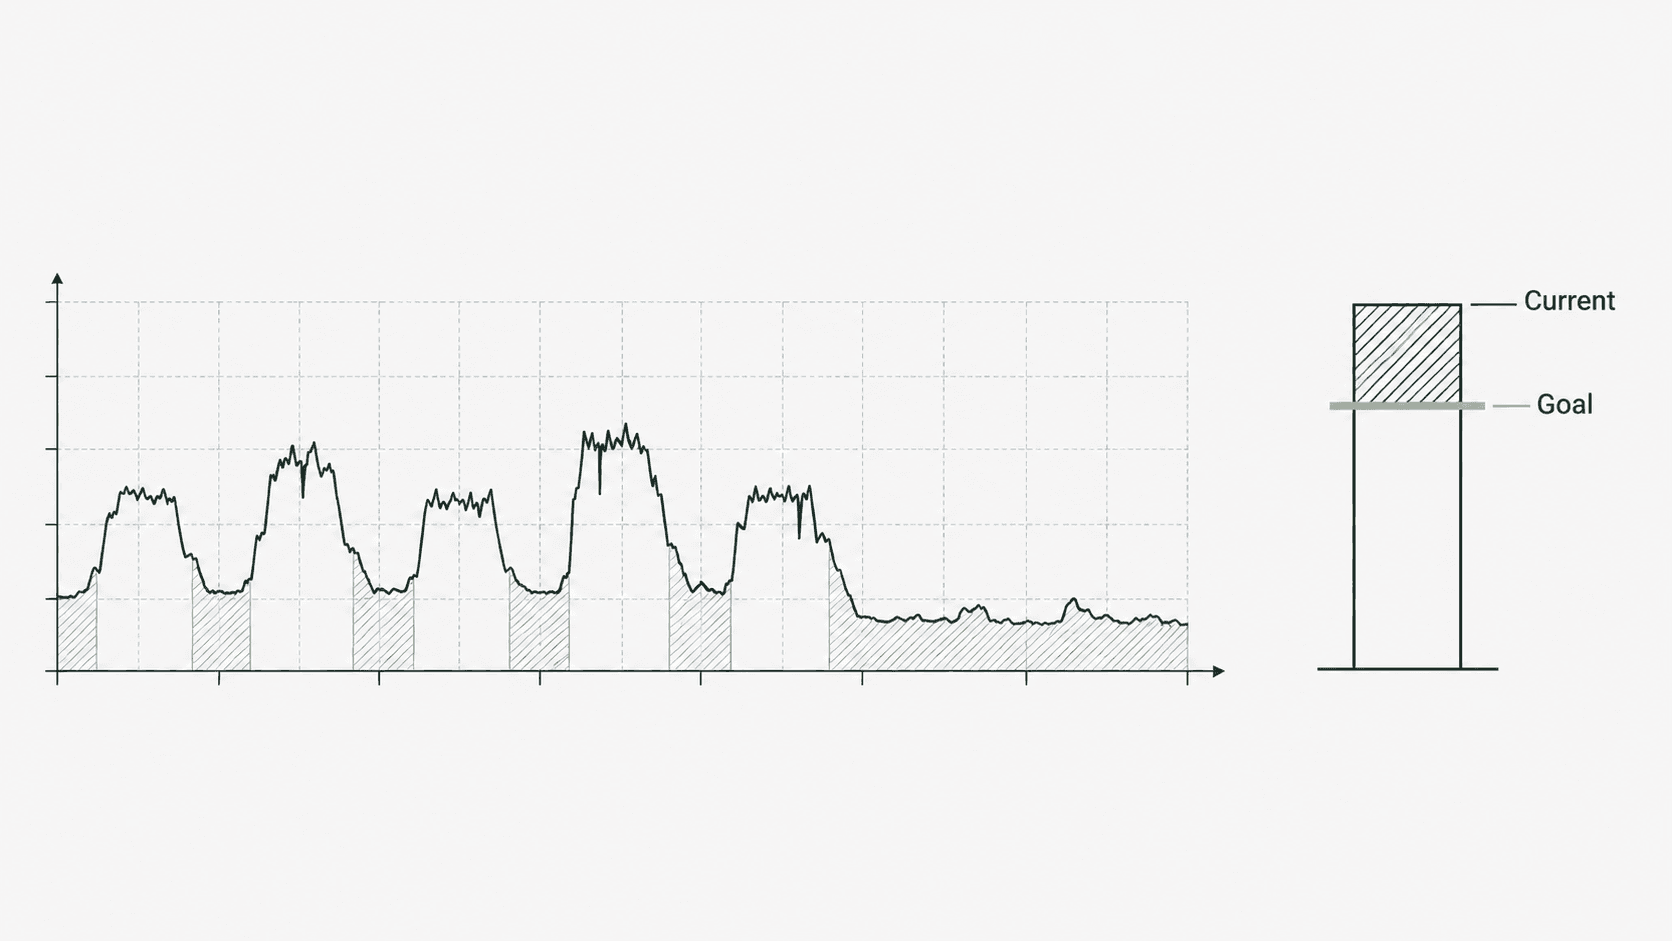
Energy waste is above your target. Time to take action.
Where it comes from. Compressors with automations no one remembers setting. Heating elements on timers. A procedure written by someone who has since moved on. It's sneaky, and it's common.
04 / Lever two · pay less for what you do use
Every rate has billing rules, and following them well gets you a low cost while following them poorly gets you a high one. Nothing tells you which one you're doing. You just get the cost.
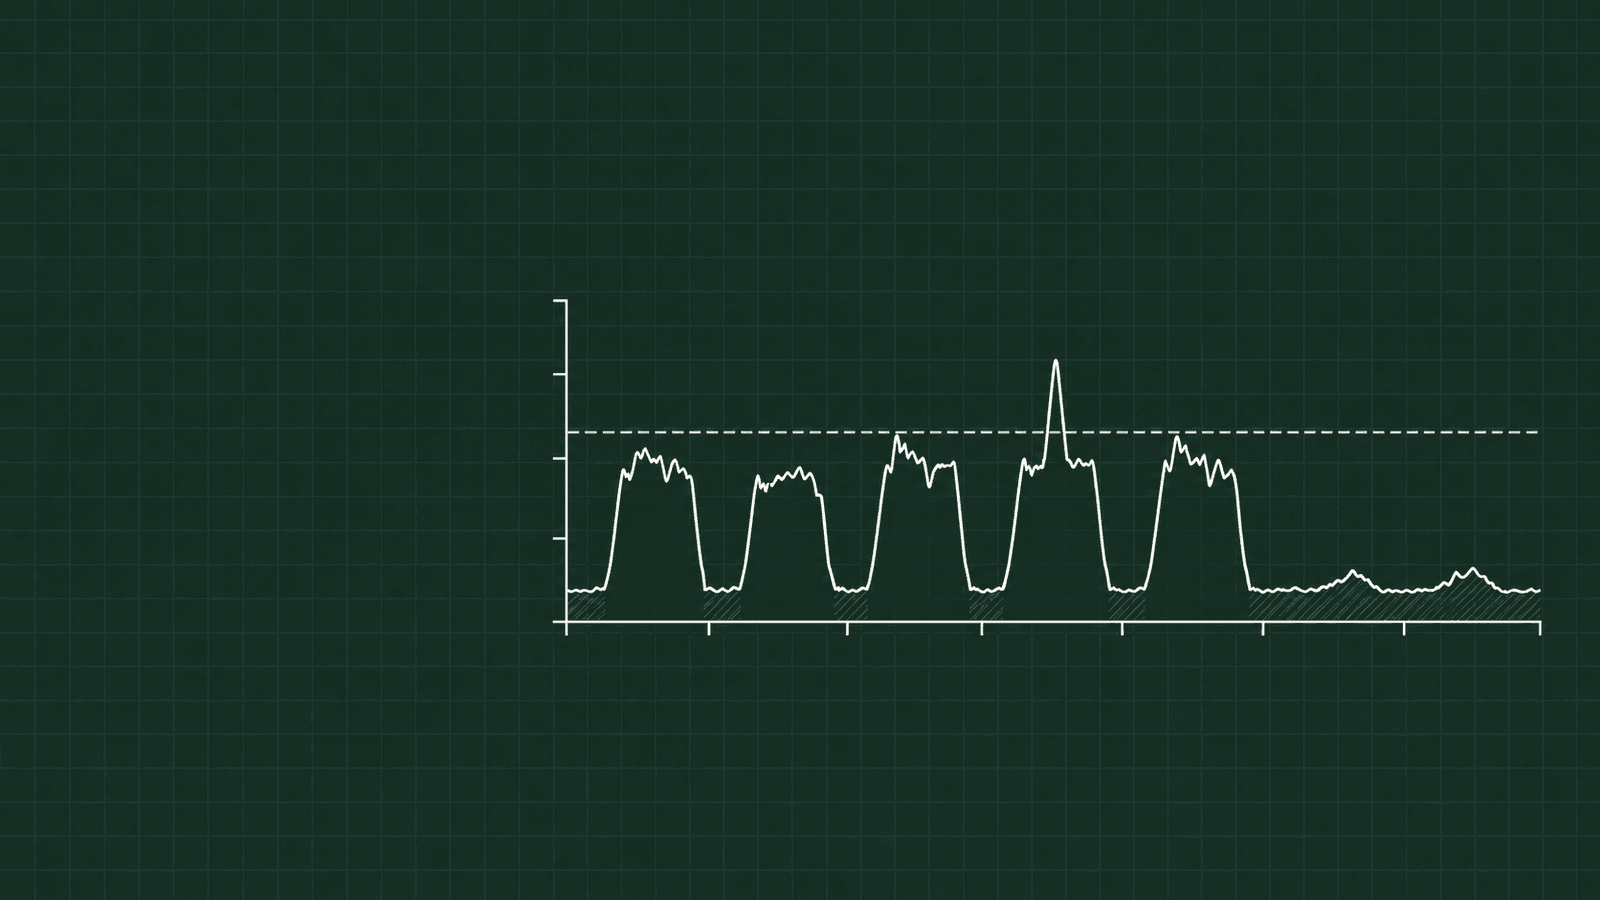
On a demand-based rate you're billed on your single highest 30-minute demand, even if you only hit it once and the rest of the month runs far lower. VEM lays your rate's rules over your actual usage and shows you exactly where you're working against them.
One facility had only eight demand spikes over most of a year. Those eight events set the bill for six full months, at 25% to 40% above what it needed to pay. It didn't need a massive change in how it operates. It needed a plan for eight exceptional events.
Rate switching: Improving how you use your rate can qualify you for a better one. You can move between rates in either direction once your numbers support it.
Your utility is certainly not going to voluntarily charge you less.
Score and goal: We call it grid efficiency. VEM scores how well you're using your rate and includes a rate calculator, so you can pick the cost per kilowatt hour you want and see the score you need to reach it. Then that goal becomes your operating guide.
05 / capabilities

What is this plant actually using, and when? Hardware on your site sends live usage data to the cloud every couple of seconds.

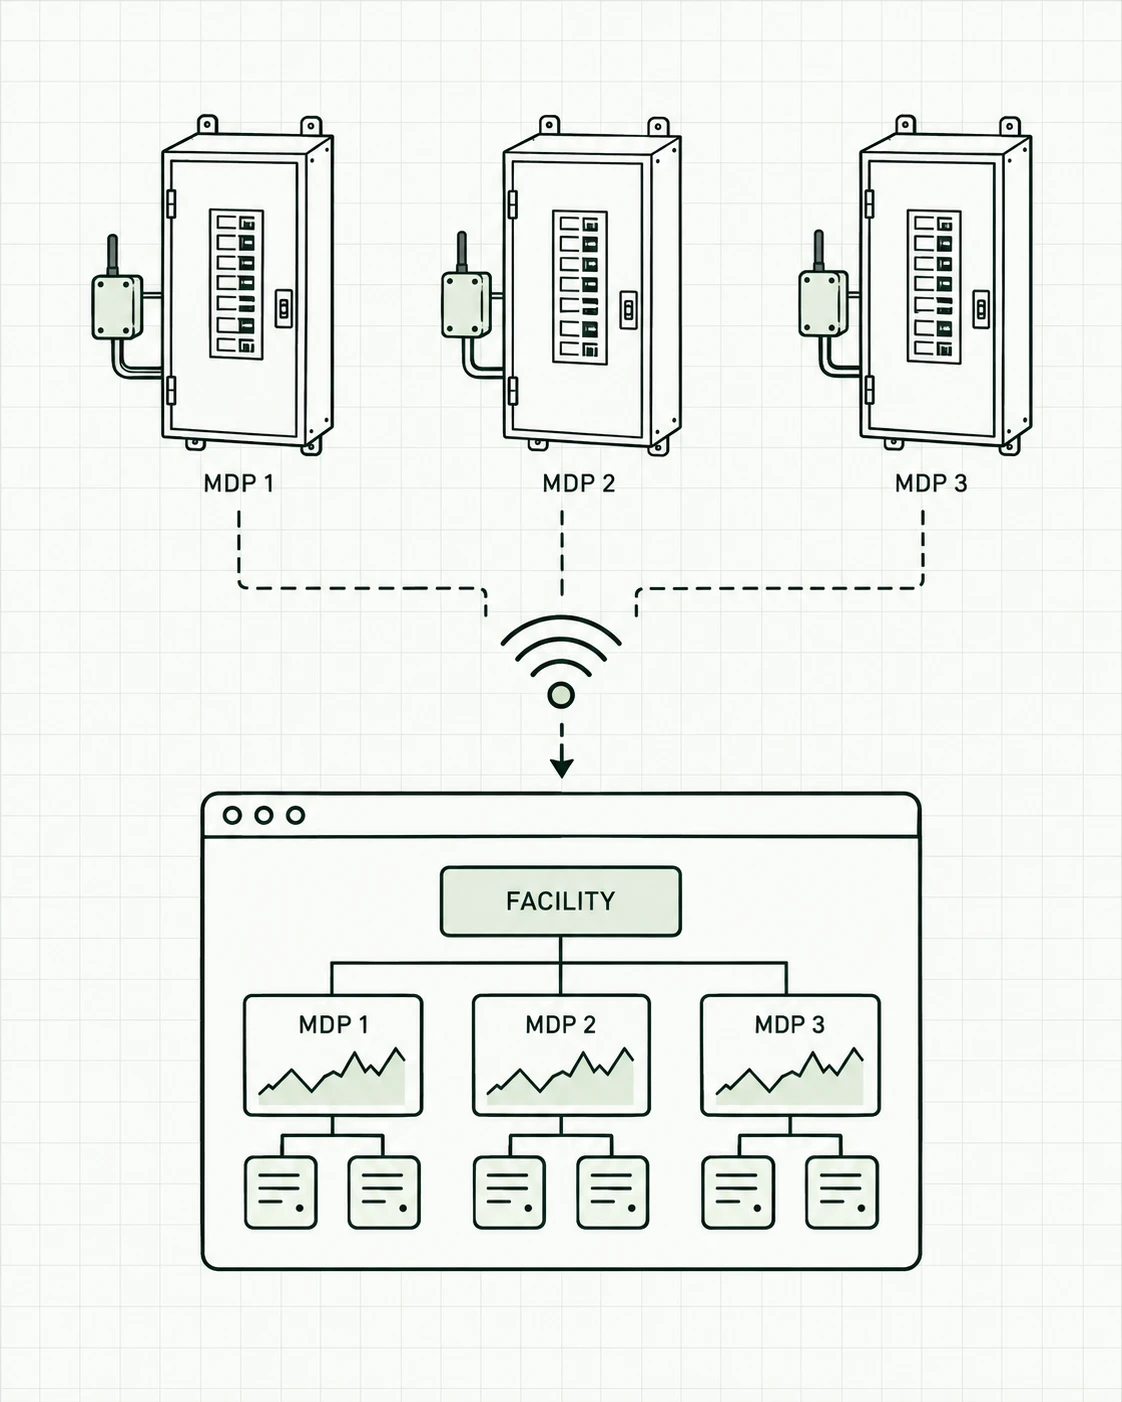
Which building, and which utility account, is this coming from? Dashboards mirror your physical buildings and utility accounts, so every number ties to a place and a bill.

What are we aiming at, and how do we know we're getting there? Two simple metrics, energy overhead and grid efficiency, each with a goal you set.

How do I know it's working? The system measures its own savings: energy waste month over month, cost per kilowatt hour, Scope 2 emissions, and savings as they add up against your baseline.

Who teaches my team to use this? Short two-to-five-minute videos matched to what you see on the dashboard: you see something, you watch the video, you know what to do.

What if we get stuck? We're available on Teams calls and on site to work out the answer to whatever question the data raises.
06 / measures
Everything required to manage billable power.
1 three-phase load · 3 phases
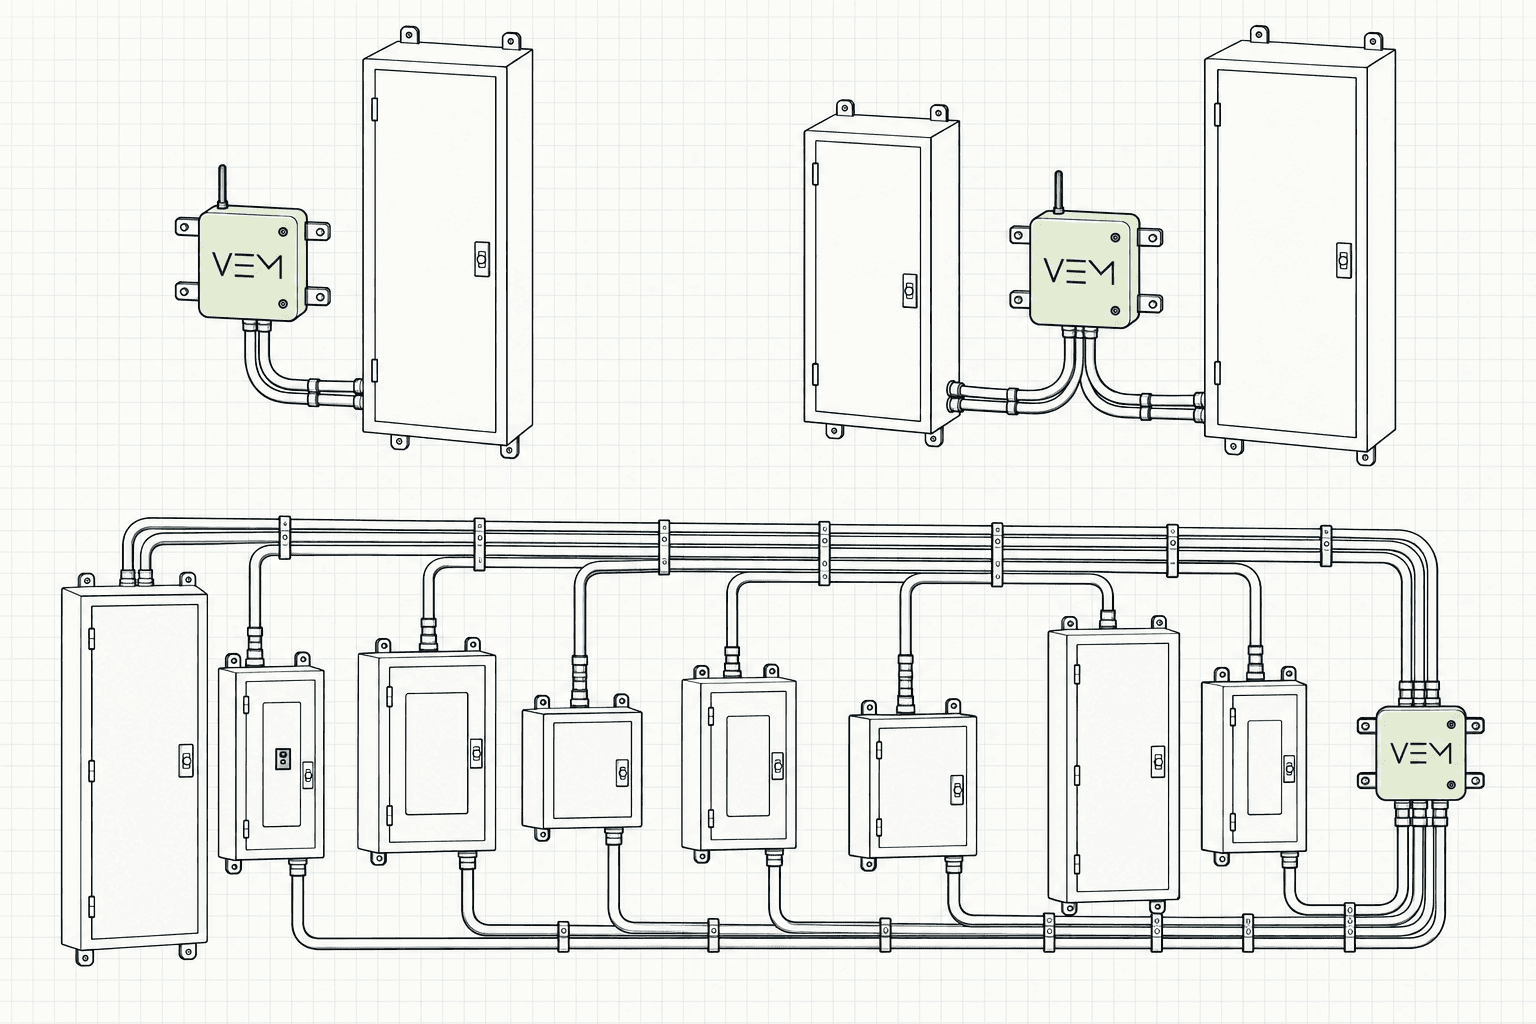
Up to 4 three-phase loads · 12 phases
Up to 16 three-phase loads · 48 phases
Representative panel arrangements. The number of panels pictured is not the monitoring limit.
07 / how built
We start from physical reality: the utility meter, the transformers it feeds, the main distribution panels, and the buildings they serve. Then we build the software mirror to match.
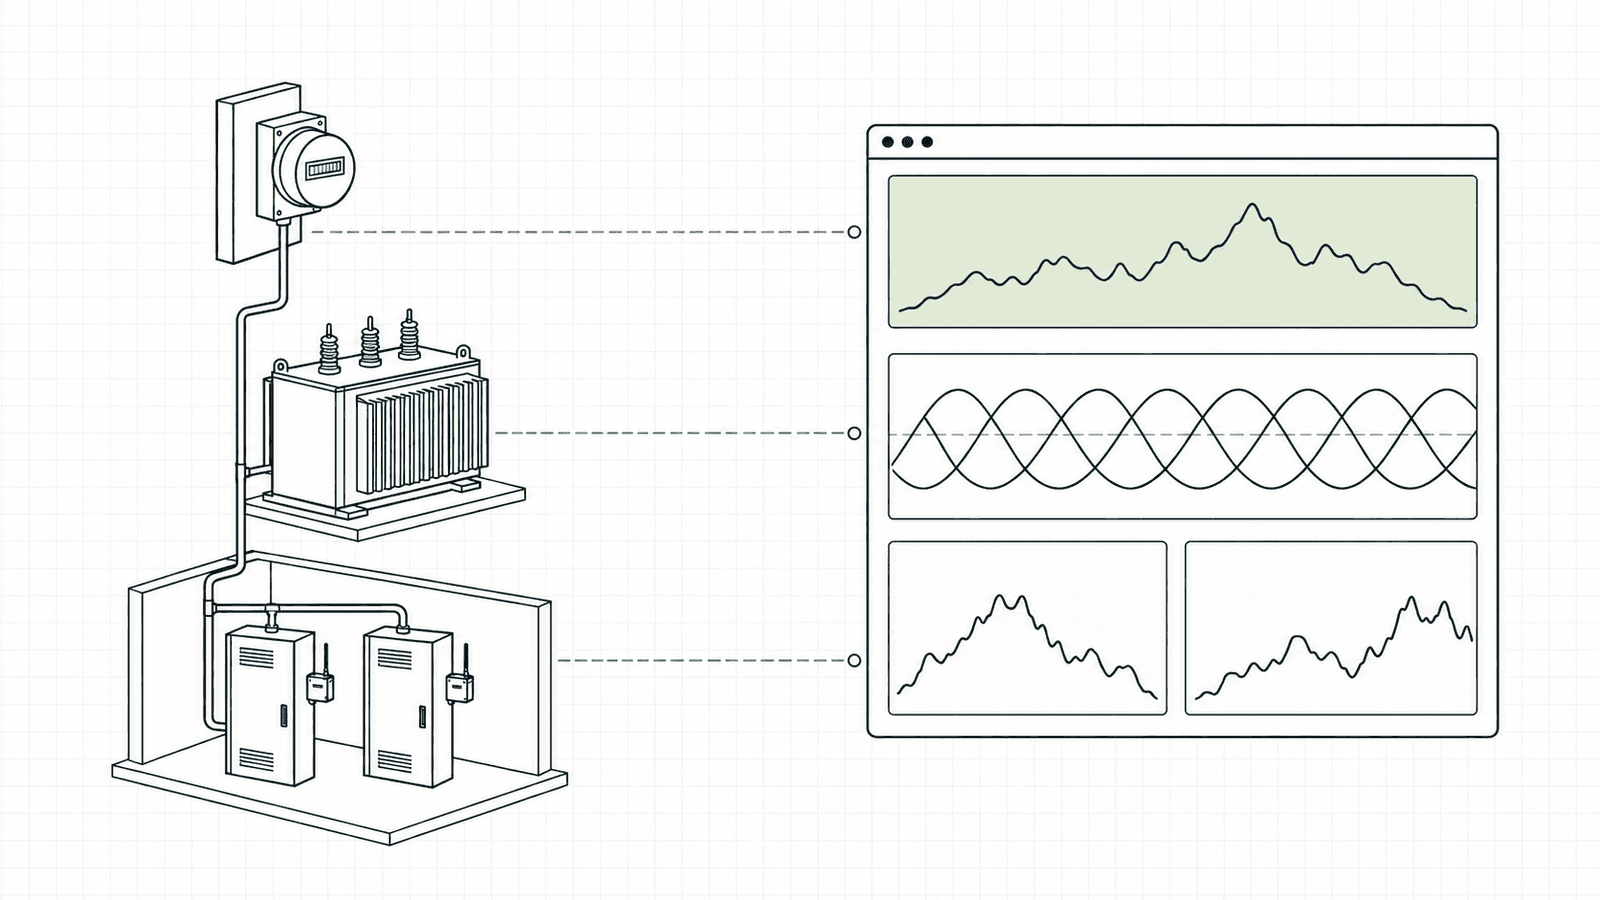
Your facility's layout decides the hardware; we don't pick it arbitrarily. On a big campus with only a couple of utility meters, this is what makes it possible to see which building is driving the cost.
08 / jayco
Off-shift usage cut in half in about 12 months
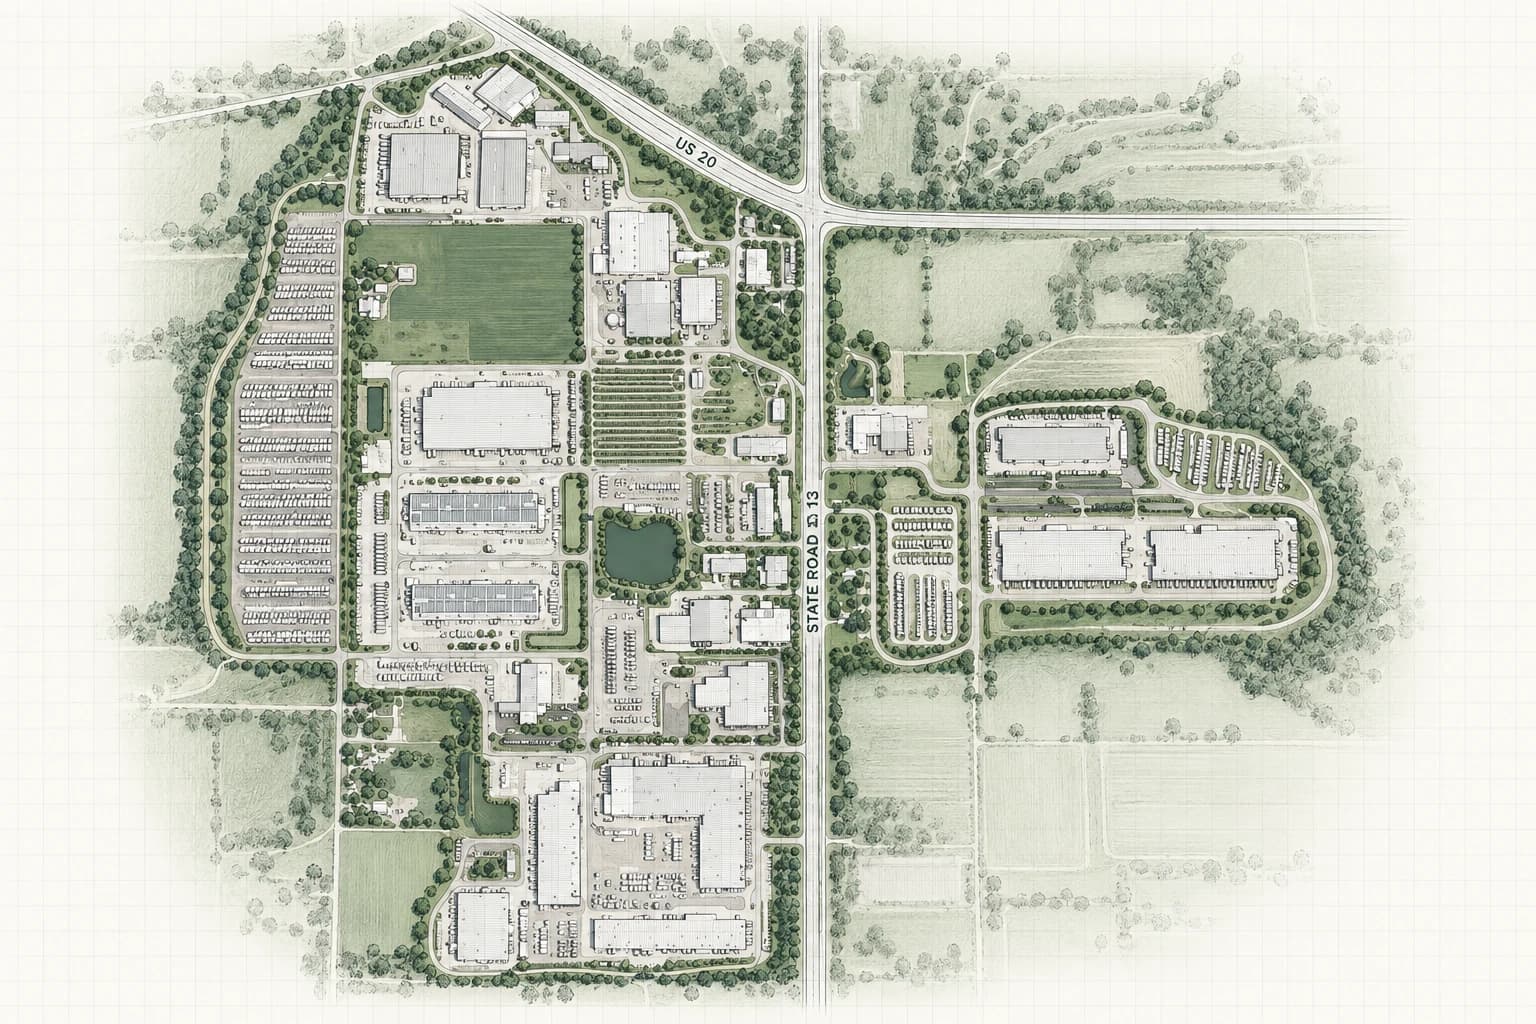
Trailing usage at the end of the day was costing one Jayco building $10,813 a year. Once we found the fix there, it could be copied to every other building on the campus.
A small hospital pushing about 12% savings. Schools typically save 12% to 15%. We've seen it work in manufacturing, assembly, medical, and schools.
09 / getting vem
Your maintenance lead opens a link on their phone and gets walked to the transformer and main panel for a few numbers and photos. It takes about 10 to 15 minutes.
You get the system design, the costs, and the business case modeled for your facility, ready to take to your CFO.
A TEG-certified technician takes care of the install.
We connect you to the cloud, build your dashboards, match your data to your utility bill, and establish your baseline.
Your team and ours sit down with your numbers and load profiles, walk the facility, and build the strategy. That takes 90 minutes to a few hours, whatever you want to give us.
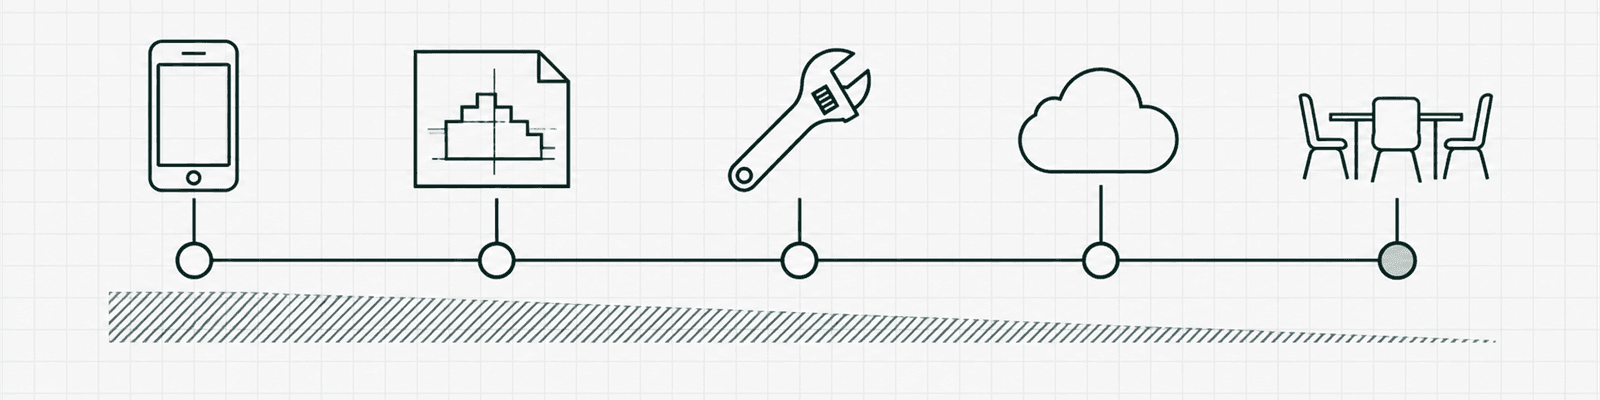
What it takes from you: More up front, less over time. There will be a couple of weeks where energy is on your mind. The goal isn't to add time to your day. It's to do the start of the day and the end of the day better. Once it's running, we have users who check their dashboards five minutes a day, three days a week.
10 / pricing
There are three costs, and only one of them repeats.
One time
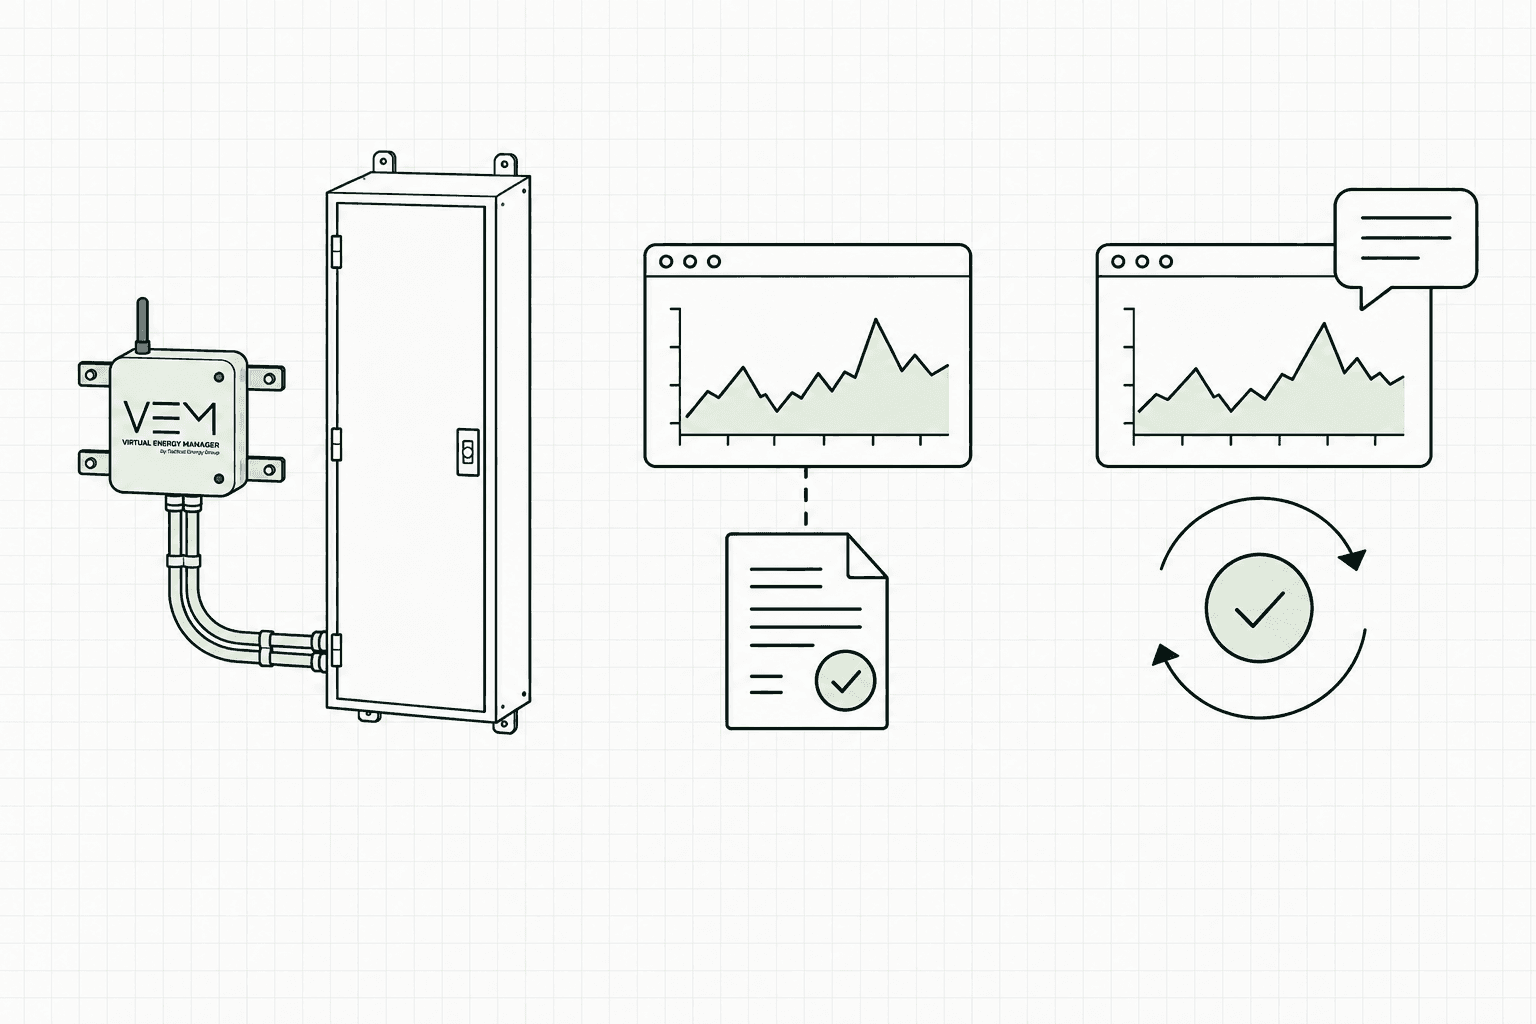
Built for your facility's layout.
One time
Dashboards built, data connected, and matched to your utility bill. Dashboards are built once and serve you from then on.
Ongoing
The software, updates, training, and support from our team, priced as a small percentage of your annual electric spend. Longer terms cost less.
We build your business case at the low end of what our users save, because we want to under-promise and over-deliver.
VEM2.0 · Coming 2027Q1
Shaped by 18 months of feedback from the people who use VEM every day, with deeper visibility and the features you have been asking for.
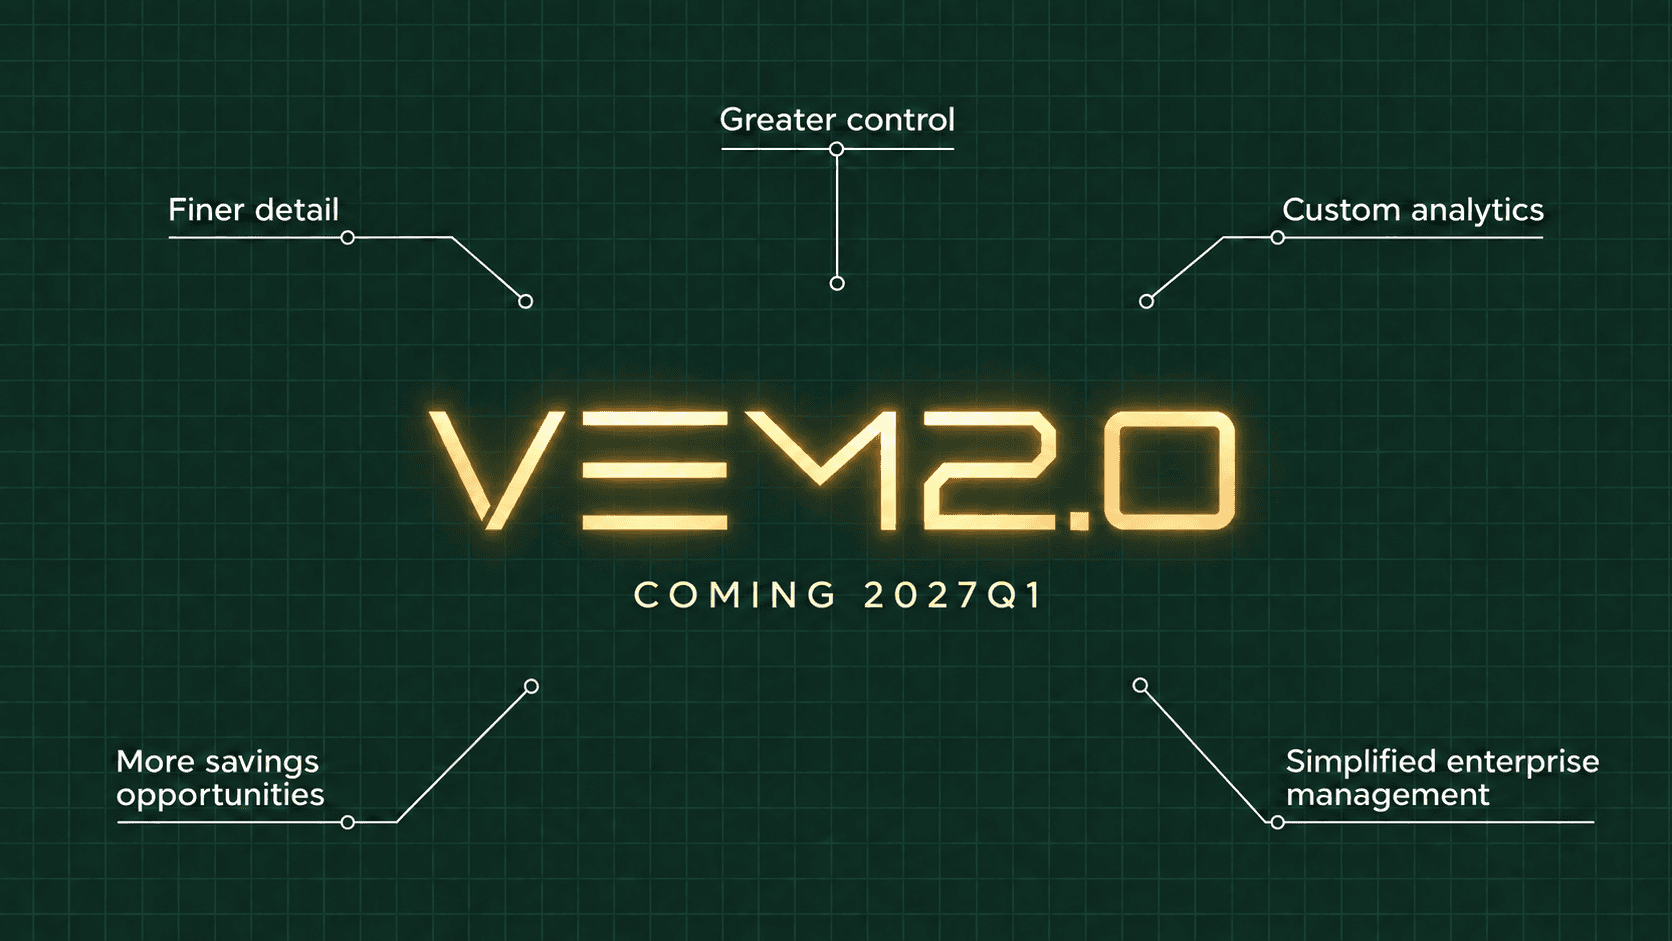
Already on VEM? Your hardware carries forward. Moving to the new platform is a flip of the switch.
Get the Blueprint12 / faq
We write guarantees case by case. Once we've surveyed your facility and modeled the business case, we'll talk through what you need and what we can stand behind, and put it in writing.
Not to start. There's so much opportunity at the first layer of visibility. If you want submetering later, that first layer helps you design it correctly.
Yes. It's web-based, and many facilities show it on a monitor on the floor.
Changes in equipment and usage are all handled by the system. The only time the hardware changes is when you add a transformer or a main panel.
Explore the Manufacturers Energy Grant Program, or book an Energy Decision Blueprint session to discuss your toughest energy questions.
When you want a second set of eyes on the bills you already pay
Manufacturers from qualifying Indiana counties receive a free monthly 35-point audit of their electric bills for cost recovery and savings. No obligation and no vendor picks.
Claim your GrantWhen a project, proposal or decision is already on your desk
The Energy Decision Blueprint gets you a free in-depth strategic assessment of your project, problem, or question by the TEG team. Move forward and design your solution with absolute confidence.
Get the Blueprint14 / closing
Find out what your plant is paying for and doesn't need.
Get the Blueprint